Power and Energy Density. What is it?
This lab experiment furthers study into power and energy density begun by examining modern hybrid automobiles. By testing our own automobiles, a greatly reduced in size Lego model version, powered by a Fuel Cell, a Lego Capacitor and a 1.5V Battery we found that the capacitor powered the car the fastest it had to be recharged after each use whereas the battery produced lower power but over a much longer time.
Background
This experiment grew out of an introduction to Ragone Plots and introductionary material to many of the courses key concepts, such as energy and power density. It serves as a follow up to calculations of these metrics for a Chevy Bolt and a Toyota Camry which were pitted against each other. It was seen that with an electric battery and gas powered internal combustion engine (ICE) a variety of configurations could be used based on whether a user (driver) desired more up-front power or long distance energy. To further understand these concepts and the interplay of energy pathways we set about to create an experiment which would test power source to preferred end use.
Experimental Design
Discussion
This experiment uses a car made of Legos powered by various energy storage units - a battery, a capacitor, and a fuel cell - to ultimately calculate the energy density and power density of each type of storage unit. In order find these metrics, we measured the distance the car traveled, the amount of time that it took the car to travel that distance and the mass of the car and the storage unit. Using these measurements, velocity (m/s), acceleration (m/s2), force (N), energy (J), Power (W) can be calculated and used to find the energy density (Wh/g) and power density (W/g) of each unit. The measurements required to find these values were taken by measuring the Lego car as it moved across the lab table.
Apparatus
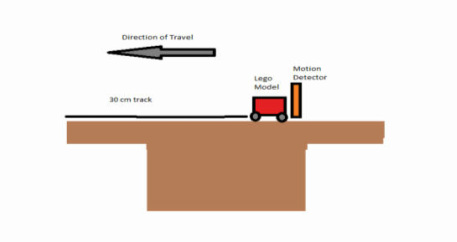
This lab, in brief, uses a straight track of table on which a released model car will travel while being recorded by a motion detector. The car is powered using three different energy storage units: a Lego Capacitor, a 1.5 V AAA Battery and a Hydrogen Fuel Cell. For each set of trials, the model car, built from Lego bricks, was outfitted by either the batter, capacitor or fuel cell. Each storage unit was then connected to a small motor, which was attached to the front of the car in an effort to prevent the vehicle from rearing during testing. This motor, powered by each storage unit during their respective trials, was connected to gears that in turn caused the car’s wheels to spin and the car to move.
This lab experiment furthers study into power and energy density begun by examining modern hybrid automobiles. By testing our own automobiles, a greatly reduced in size Lego model version, powered by a Fuel Cell, a Lego Capacitor and a 1.5V Battery we found that the capacitor powered the car the fastest it had to be recharged after each use whereas the battery produced lower power but over a much longer time.
Background
This experiment grew out of an introduction to Ragone Plots and introductionary material to many of the courses key concepts, such as energy and power density. It serves as a follow up to calculations of these metrics for a Chevy Bolt and a Toyota Camry which were pitted against each other. It was seen that with an electric battery and gas powered internal combustion engine (ICE) a variety of configurations could be used based on whether a user (driver) desired more up-front power or long distance energy. To further understand these concepts and the interplay of energy pathways we set about to create an experiment which would test power source to preferred end use.
Experimental Design
Discussion
This experiment uses a car made of Legos powered by various energy storage units - a battery, a capacitor, and a fuel cell - to ultimately calculate the energy density and power density of each type of storage unit. In order find these metrics, we measured the distance the car traveled, the amount of time that it took the car to travel that distance and the mass of the car and the storage unit. Using these measurements, velocity (m/s), acceleration (m/s2), force (N), energy (J), Power (W) can be calculated and used to find the energy density (Wh/g) and power density (W/g) of each unit. The measurements required to find these values were taken by measuring the Lego car as it moved across the lab table.
Apparatus
This lab, in brief, uses a straight track of table on which a released model car will travel while being recorded by a motion detector. The car is powered using three different energy storage units: a Lego Capacitor, a 1.5 V AAA Battery and a Hydrogen Fuel Cell. For each set of trials, the model car, built from Lego bricks, was outfitted by either the batter, capacitor or fuel cell. Each storage unit was then connected to a small motor, which was attached to the front of the car in an effort to prevent the vehicle from rearing during testing. This motor, powered by each storage unit during their respective trials, was connected to gears that in turn caused the car’s wheels to spin and the car to move.
Technique/Procedure
To measure the car’s movement, the car was placed in front of the motion detector immediately after the powering device (i.e. capacitor, batter or fuel cell) was connected to the motor. As the car was placed on the 30” long track, the motion sensor was simultaneously activated and it began to record the distance the car traveled and the time that it took the car to reach the end of the track. The motion detector was connected to the computer, where its associated software package recorded and stored data.
To measure the car’s and the storage unit’s mass, each item was measured separately and together in order to find the data necessary to normalize each storage unit’s energy and power.
Data was then collected from the tables created by the software program; controlling for time, distance data was taken from the moment at which the motion detector had been recording for two seconds. The 2 second mark was chosen because it seemed like enough time for the car to have accelerated and because it tended to capture a speed to distance rate that reoccurred throughout the entire experiment. A time earlier than this 2 second benchmark proved to inconsistent as lag between model start and data collection by the sensor prevent usage of data before 2 seconds. Later times were likewise unusable due to the short track and the fact that the motion of the car, and therefore recorded measurements, had to be arrested to prevent collision. The trial was conducted 3 times for the capacitor operated model and 4 times for the battery operated model
Experimental Observations
Data
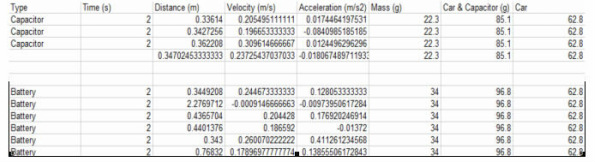
Data was recorded in a Google spreadsheet in preparation for publishing to the web directly after the experiment was done. The Lego built car weighed 68.2 g. The capacitor weighed 22.3 g and the battery used weighed 34 g. For the capacitor time trials: Average Distance recorded was .34 m, Average Velocity was .24 m/s and Average Acceleration was -.018 m/s^2. For the battery time trials: Average Distance recorded was .77 m, Average Velocity was .179 m/s, and Average Acceleration was .14 m/s^2.
Experimental Analysis
Calculations
The motion detector and software did all the needed calculations and therefore no further formulas or transformations were necessary.
Graphs
Due to sample size any graph would have presented results in a non-representative manner and therefore is not included.
Results
The low sample size should be considered as being highly detrimental to data and analysis integrity. This is most easily seen in some of the average numbers produced, such as negative average acceleration.
Conclusion
The capacitor did seem to produce a model which had higher velocity which was easily observed. It also had to be charged after every experimental run. This shows the interconnection and ofset between power and energy.
To measure the car’s movement, the car was placed in front of the motion detector immediately after the powering device (i.e. capacitor, batter or fuel cell) was connected to the motor. As the car was placed on the 30” long track, the motion sensor was simultaneously activated and it began to record the distance the car traveled and the time that it took the car to reach the end of the track. The motion detector was connected to the computer, where its associated software package recorded and stored data.
To measure the car’s and the storage unit’s mass, each item was measured separately and together in order to find the data necessary to normalize each storage unit’s energy and power.
Data was then collected from the tables created by the software program; controlling for time, distance data was taken from the moment at which the motion detector had been recording for two seconds. The 2 second mark was chosen because it seemed like enough time for the car to have accelerated and because it tended to capture a speed to distance rate that reoccurred throughout the entire experiment. A time earlier than this 2 second benchmark proved to inconsistent as lag between model start and data collection by the sensor prevent usage of data before 2 seconds. Later times were likewise unusable due to the short track and the fact that the motion of the car, and therefore recorded measurements, had to be arrested to prevent collision. The trial was conducted 3 times for the capacitor operated model and 4 times for the battery operated model
Experimental Observations
Data
Data was recorded in a Google spreadsheet in preparation for publishing to the web directly after the experiment was done. The Lego built car weighed 68.2 g. The capacitor weighed 22.3 g and the battery used weighed 34 g. For the capacitor time trials: Average Distance recorded was .34 m, Average Velocity was .24 m/s and Average Acceleration was -.018 m/s^2. For the battery time trials: Average Distance recorded was .77 m, Average Velocity was .179 m/s, and Average Acceleration was .14 m/s^2.
Experimental Analysis
Calculations
The motion detector and software did all the needed calculations and therefore no further formulas or transformations were necessary.
Graphs
Due to sample size any graph would have presented results in a non-representative manner and therefore is not included.
Results
The low sample size should be considered as being highly detrimental to data and analysis integrity. This is most easily seen in some of the average numbers produced, such as negative average acceleration.
Conclusion
The capacitor did seem to produce a model which had higher velocity which was easily observed. It also had to be charged after every experimental run. This shows the interconnection and ofset between power and energy.
