Potential Energy and Hydroelectric Efficiency
This experiment was undertaken to test the efficiency of a Lego hydroelectric turbine. Positioned underneath water-filled buckets, the turbine received a constant flow of water which set the turbine in motion and generated electricity. To determine the efficiency, volt, current and as well as baseline measurements were taken and then manipulated through calculations geared toward discovering the efficiency of this particular turbine. This turbine was not very efficient, understandable given that it is constructed out of Legos and was subject to all sorts of limitations.
Background
This experiment looks at hydroelectric power that is generated by the force of falling water. The potential energy of water is captured once it begins falling by the hydroelectric turbine to produce mechanical energy. The mechanical energy is then converted to electricity by the magnets that move through the coil loop in the generator. The electricity generation in the hydroelectric turbine very closely mirrors that of the wind turbine as both are able to capture motion from natural resources (water and wind, respectively) and ultimately convert it to electricity.
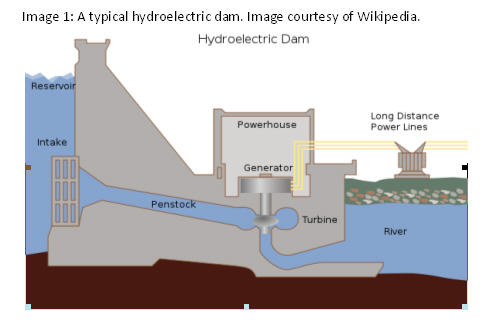
From the Hoover Dam to the 3-Gorges project running water has been being converted to electricity for many years (See Image 1). Since ancient times the power of water in motion has been used to a variety of effects. Whether cutting wood, grinding grain, or for the more modern needs of electricity living on the surface of world covered by mostly water we cannot, and have not, ignored this incredibly powerful and available power source. This lab attempts to teach some of the fundamental methods, calculations, and physics behind harnessing the power of water.
This experiment was undertaken to test the efficiency of a Lego hydroelectric turbine. Positioned underneath water-filled buckets, the turbine received a constant flow of water which set the turbine in motion and generated electricity. To determine the efficiency, volt, current and as well as baseline measurements were taken and then manipulated through calculations geared toward discovering the efficiency of this particular turbine. This turbine was not very efficient, understandable given that it is constructed out of Legos and was subject to all sorts of limitations.
Background
This experiment looks at hydroelectric power that is generated by the force of falling water. The potential energy of water is captured once it begins falling by the hydroelectric turbine to produce mechanical energy. The mechanical energy is then converted to electricity by the magnets that move through the coil loop in the generator. The electricity generation in the hydroelectric turbine very closely mirrors that of the wind turbine as both are able to capture motion from natural resources (water and wind, respectively) and ultimately convert it to electricity.
From the Hoover Dam to the 3-Gorges project running water has been being converted to electricity for many years (See Image 1). Since ancient times the power of water in motion has been used to a variety of effects. Whether cutting wood, grinding grain, or for the more modern needs of electricity living on the surface of world covered by mostly water we cannot, and have not, ignored this incredibly powerful and available power source. This lab attempts to teach some of the fundamental methods, calculations, and physics behind harnessing the power of water.
Experimental Design
Discussion
This experiment looks at how wind generators operate and how efficient they are by tracking the power that can be captured using them. To determine this, this experiment measures a number of different variables: voltage (V), current (A), water velocity (m/s), and the kinetic energy of the water in a series of buckets. These metrics are then used to calculate Powerin, Powerout, and the efficiency of the generator used in this experiment.
Apparatus
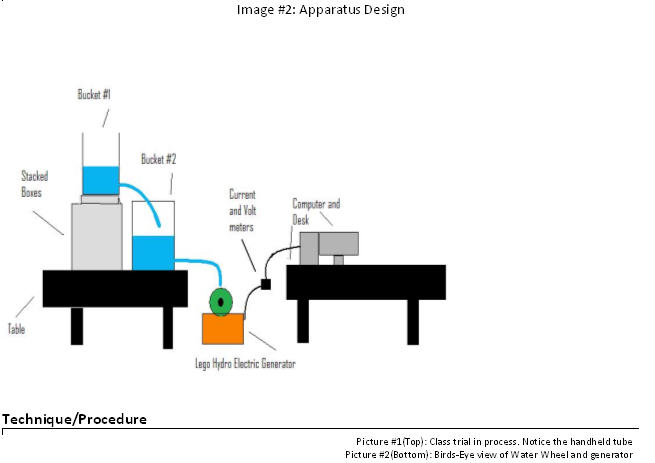
The instrument used for this device consisted of 2 buckets and a Lego brick constructed hydroelectric generator. One bucket (#1) filled another bucket (#2) to keep it at a steady height of water and therefore a steady rate of potential energy as water flowed out of the second bucket onto the wheel of the hydroelectric generator. Image #2 shows a rough diagram of the entire apparatus design whereas Picture 2 shows the design of the generator and water wheel. The tubes used were ~ 1” in diameter. The buckets were identical and each had a diameter of 11.25” +/- .125”. The height of the water in the bucket was 5.75 “ +/- .25 “. The water flow rate was controlled by turning the nozzle allowing water to flow freely out of the bucket and through the tube. Vernier software and associated, voltage, current, and flow rate meters were used to record the necessary data for this experiment.
Image #2: Apparatus Design
Discussion
This experiment looks at how wind generators operate and how efficient they are by tracking the power that can be captured using them. To determine this, this experiment measures a number of different variables: voltage (V), current (A), water velocity (m/s), and the kinetic energy of the water in a series of buckets. These metrics are then used to calculate Powerin, Powerout, and the efficiency of the generator used in this experiment.
Apparatus
The instrument used for this device consisted of 2 buckets and a Lego brick constructed hydroelectric generator. One bucket (#1) filled another bucket (#2) to keep it at a steady height of water and therefore a steady rate of potential energy as water flowed out of the second bucket onto the wheel of the hydroelectric generator. Image #2 shows a rough diagram of the entire apparatus design whereas Picture 2 shows the design of the generator and water wheel. The tubes used were ~ 1” in diameter. The buckets were identical and each had a diameter of 11.25” +/- .125”. The height of the water in the bucket was 5.75 “ +/- .25 “. The water flow rate was controlled by turning the nozzle allowing water to flow freely out of the bucket and through the tube. Vernier software and associated, voltage, current, and flow rate meters were used to record the necessary data for this experiment.
Image #2: Apparatus Design
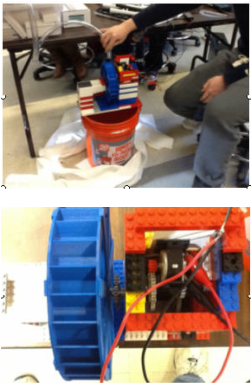
After setting up the apparatus for the experiment, the valves were open 100% for each trial on both buckets. Five trials were performed by our group and an additional 3 were performed by the class as a whole. At the beginning of each trial both buckets were filled to the same height and their valves opened completely at the same time this allowed for accurate measurements of potential energy and to decrease delay, and therefore error, in the calculation process. The tube, shown in Picture #1, which served as the pathway for the water from the bucket to the water wheel was handheld. Errors associated with this method will be detailed later in the errors section.
Data was captured for varying times for each trial. The class trials collected data for approximately one minute. The group trials and flow velocity data varied between 20 and 25 seconds of data collection. No changes were made to either the buckets, valves or generator between trials.
Experimental Observations
Data
Data was exported on a per trial basis by the Vernier software to a tab delineated text file. Each trial data set was then imported into an excel spreadsheet for calculations before being imported to a Google spreadsheet for publication. Measurements of water velocity was conducted independently and averaged over the 60 second trial .9869 M/s using the vernier compatible anemometer which are typically used for air speed but was adapted for use as a water measuring tool. For each trial the data was recorded for every .2 seconds. The raw data is available under the data links section of this website. Information on current and voltage was measured and through the equations discussed in the experimental analysis section the Power output of the generator was calculated. Each trials data for Current, Voltage and Power at each time step was calculated and then the average of these values was published to the data section and in the graphs section below.
Experimental Analysis
Calculations
The equations below show the needed calculation which were performed to find the kinetic energy of the water as it fell which became our power in metric. Our power out was calculated by Equation #1. This standard equation defines power as the voltage times the current. Both of these were measured by attached Vernier devices. Using Equation #2 the power in of the water was calculated. This is another standard equation which states that the power is equal to half the density of water times the area times the velocity cubed. The relative density for water is ~1, the area was calculated based on the 1” diameter tubes used, and the V as the velocity was recorded based on the anemometer readings. The area of the tube, since3 the same size tube was used for all trials was a constant of .78 inches^2. For ease of calculation this was rounded to 5. Equation #3 therefore was used to find the efficiency being Power Out divided by Power In.
Equation #1: Powerout = V x I
Equation #2: Powerin = water A3
Equation #3: Efficiency = Power Out/Power In
Equation #4: Area = pi*r^2
Graphs
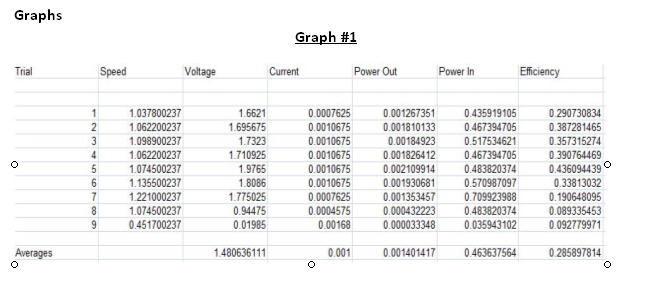
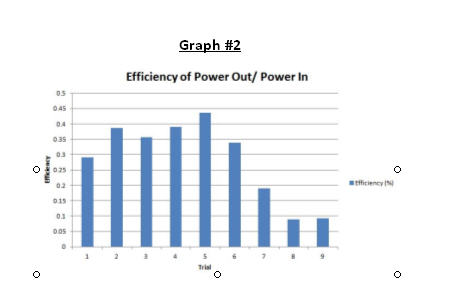
The compiled average calculations for these experimental trials are listed in graph #1. Graph #2 shows a side-by-side comparison of the calculated efficiencies. The trials our group ran (1-6) were 2 to 3 times more efficient than the class run tests. This is due to the differences in Power In from the waters kinetic energy. None of the efficiencies was particularly high, with .4 percent being the highest efficiency.
Errors
No measurement is perfect; there are many instrumental, physical and human limitations that cause measurements to differ from the exact value of what is being examined. However, the bias that results is unknown as there is no theoretical value, so one needs to be meticulous when carrying out the experiment in order to avoid as many errors as possible. These experimental uncertainties can manifest in three types of error: measurement, process and methodological. Even though all of these types can be present in a given experiment, for this lab there is a focus on process error. Procedural error occurs when there are problems in the way the experiment is carried out; one often is not aware when there are inconsistencies that cause errors in a given trial. To avoid procedural errors, not only must one be consistent and careful when taking measurements, many trials must be carried out in order to reduce the effect of errors in the final analysis. The more trials completed in an experiment means that the results will likely see a decrease in error and will therefore be more accurate.
Many errors were present during this experiment. The buckets were placed at different heights so had different values for kinetic energy which caused the second bucket to fill slightly faster than the first bucket drained of water. The tubing used to direct water from the second bucket onto the wheel of the hydroelectric generator was handheld causing an inconsistent angle and flow direction. The flow rate sensor had +/- 1% error rating as listed by the specification sheet. The current probe had a +/- of .6 Amps and a linearity rating of .01%.
Conclusion
Even though this experiment was plagued by a multitude of errors, it was useful in gaining a better understanding of the concepts and principles pertaining to hydroelectric turbines and electricity derived from harnessing the energy embodied in falling water. The hydroelectric turbine used was not the most efficient system, but it is understandable given that it was a model meant for classroom use. This experiment should not be used to examine the efficiencies of all turbines; rather it serves more as a model for helping participants understand the ins and outs of hydroelectricity.
