Effects of Wind Vectors on Power Generation Efficiency in a Wind Turbine Generator
This experiment measured the power produced by a small wind turbine built from Lego bricks to determine the efficiency of wind power. To compare and contrast how the wind turbine behaved at different wind speeds, two different fans that produced different wind speeds were used to examine how the efficiency differed at a given wind speed. Vernier software was used to measure the Kinetic energy of the wind and a volt and current meter were used to measure the output power from the turbine generator. Though the results were suspect and fraught with errors the exercise proved successful in increasing the knowledge base of all participating members.
Background
This experiment looks at mechanical to electrical energy conversion. There are two types of mechanical energy: potential energy from gravity and kinetic energy from motion. Potential energy can be gleaned from stored water using pumps and water stored from tidal activity. Kinetic energy, the type of energy that this lab is concerned with, can be collected by capturing energy from human motion, wind motion and water motion. In essence, anything moving can produce mechanical energy.
Wind turbines, which take advantage of wind energy, are able to capture the mechanical energy produced by wind and convert it to electrical energy by virtue of magnets and coils that harness the motion to produce magnetic fields and current. To create a magnetic field, electrons must move through the coil loop, whereas to create current, the magnet must move in the loop. This coil and magnet set-up has a dual purpose as it can act both as a motor or a generator. The generator, which is the entity that converts mechanical to electrical in a wind turbine, produces electricity as the force (wind) rotates coils via the turbine blades near the magnet to create the current. In this experiment, the coils and magnets act as a generator; however, the flow of electricity can be reversed (provided that there is an energy supply) and used as a motor which uses electricity by sending current through coils near the magnet to create force and torque. In the case of a wind turbine, there are two different types of mechanical energy present – linear energy and rotational. The linear energy is the energy that comes from wind, whereas the rotational energy is the energy that is from the turbine.
Experimental Design
Discussion
This experiment looks at how wind turbines operate and how efficient they are by tracking the power that can be captured using wind turbines. To determine this, this experiment measures a number of different variables: voltage (V), current (A), and wind speed (m/s) from two different fan models. These metrics were then used to calculate Powerin, Powerout, and the efficiency of the generator connected to the turbine versus the power of the incoming kinetic energy of the wind.
Apparatus
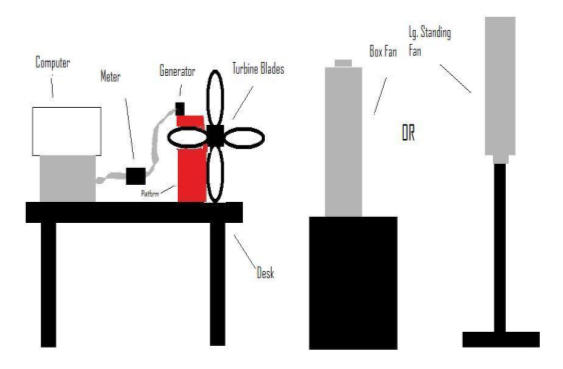
The turbine itself, constructed of Lego bricks and plastic blades, was positioned on a table facing one of two types of fans. A box fan, which has three different settings (high, medium, and low), was used to examine the turbine at lower speeds, whereas a larger standing fan, which just had one, very powerful speed, was used to see how the turbine acted under much greater speeds. The wind from these fans power the generator that is attached to the turbine. The volt meter, which measures the voltage, and the current meter, which measures the current, are attached to the generator and collect data that is sent to a computer with Data Logger software where it is captured for later analysis. To measure the wind speed, an anemometer place directly in front of the blades so that it would accurately capture the speed of the wind that hits the blades of the turbine. An image of the apparatus and setup is pictured below in Image 1. This apparatus was used for all data collection. using the techniques described below.
Image 1: Picture of apparatus and experimental setup
This experiment measured the power produced by a small wind turbine built from Lego bricks to determine the efficiency of wind power. To compare and contrast how the wind turbine behaved at different wind speeds, two different fans that produced different wind speeds were used to examine how the efficiency differed at a given wind speed. Vernier software was used to measure the Kinetic energy of the wind and a volt and current meter were used to measure the output power from the turbine generator. Though the results were suspect and fraught with errors the exercise proved successful in increasing the knowledge base of all participating members.
Background
This experiment looks at mechanical to electrical energy conversion. There are two types of mechanical energy: potential energy from gravity and kinetic energy from motion. Potential energy can be gleaned from stored water using pumps and water stored from tidal activity. Kinetic energy, the type of energy that this lab is concerned with, can be collected by capturing energy from human motion, wind motion and water motion. In essence, anything moving can produce mechanical energy.
Wind turbines, which take advantage of wind energy, are able to capture the mechanical energy produced by wind and convert it to electrical energy by virtue of magnets and coils that harness the motion to produce magnetic fields and current. To create a magnetic field, electrons must move through the coil loop, whereas to create current, the magnet must move in the loop. This coil and magnet set-up has a dual purpose as it can act both as a motor or a generator. The generator, which is the entity that converts mechanical to electrical in a wind turbine, produces electricity as the force (wind) rotates coils via the turbine blades near the magnet to create the current. In this experiment, the coils and magnets act as a generator; however, the flow of electricity can be reversed (provided that there is an energy supply) and used as a motor which uses electricity by sending current through coils near the magnet to create force and torque. In the case of a wind turbine, there are two different types of mechanical energy present – linear energy and rotational. The linear energy is the energy that comes from wind, whereas the rotational energy is the energy that is from the turbine.
Experimental Design
Discussion
This experiment looks at how wind turbines operate and how efficient they are by tracking the power that can be captured using wind turbines. To determine this, this experiment measures a number of different variables: voltage (V), current (A), and wind speed (m/s) from two different fan models. These metrics were then used to calculate Powerin, Powerout, and the efficiency of the generator connected to the turbine versus the power of the incoming kinetic energy of the wind.
Apparatus
The turbine itself, constructed of Lego bricks and plastic blades, was positioned on a table facing one of two types of fans. A box fan, which has three different settings (high, medium, and low), was used to examine the turbine at lower speeds, whereas a larger standing fan, which just had one, very powerful speed, was used to see how the turbine acted under much greater speeds. The wind from these fans power the generator that is attached to the turbine. The volt meter, which measures the voltage, and the current meter, which measures the current, are attached to the generator and collect data that is sent to a computer with Data Logger software where it is captured for later analysis. To measure the wind speed, an anemometer place directly in front of the blades so that it would accurately capture the speed of the wind that hits the blades of the turbine. An image of the apparatus and setup is pictured below in Image 1. This apparatus was used for all data collection. using the techniques described below.
Image 1: Picture of apparatus and experimental setup
Technique/Procedure
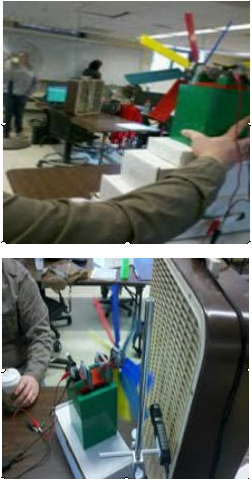
Picture 1(Top) : Apparatus and Distance of Large Fan
Picture 2 (Bottom): Apparatus and Distance of Box Fan
After setting up the equipment required for the experiment, the apparatus was adjusted to the angle desired for each trial (30 degrees and 90 degrees for the big fan trials, 90 degrees for all small fan trials). For each fan that was used in the experiment, the turbine center had to be positioned so that it was aligned with the center of the fan blades. If the wind turbine is not positioned properly, the blades are unable to capture the wind correctly and cannot produce the mechanical energy that is necessary to producing electricity. A mispositioned apparatus, and therefore the blade orientation, is a source of error discussed further in that section. At the beginning of each trial, the fan and the software that captures the data were started simultaneously in an effort to get an accurate representation of the wind and how the wind turbine responded to it. Provided that there were no incidents (e.g. the turbine’s blades falling apart), data was captured for a minute at a time, after which the fan was turned off and the data exported to a spreadsheet. Twelve separate trials were run. The first five trials were undertaken using the box fan set at its medium speed. In these trials the box fan was then set at its highest speed and another five trials were executed, with the blades in the same position as they were in the previous set of trials. The big fan was used in two separate trials; in the first trial using this fan, the blades were set at 90°. In the second trial, the blades were set at a 30° angle. Pictures 1 and 2 show a close up picture taken of the 2 fans used and the apparatus distance from wind source. With the experimental design and apparatus set we began the data collection process.
Experimental Observations
Data
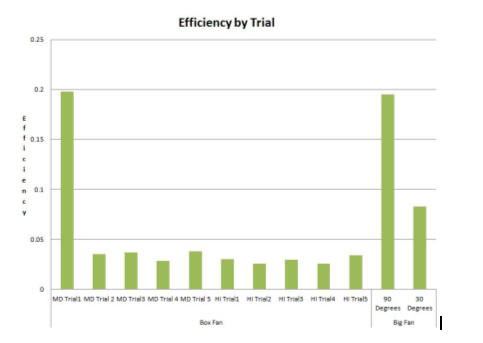
Data was exported on a per trial basis by the Vernier software to a tab delineated text file. Each trial data set was then imported into an excel spreadsheet for calculations before being imported to a Google spreadsheet for publication. Due to fluctuations (see error section)in the energy received by the wind fans and the energy produced by the generator a per trial average was used. The box fan on Medium setting with turbine blades at a 90 degree angle performed the best at ~.2 % efficiency. The next most efficient trial was with the large floor standing fan and produced a similar efficiency. Data for all of the 12 trials was included in the analysis and is available via this website’s data links section. The graph below shows the trials and efficiencies calculated. The graph show the speed (Medium,MD,or High,HI) , the angle of the turbine blades , trial number , and the calculated efficiencies for the box fan. It also shows the Big Fan values for efficiency at both 30 and 90 degree turbine blade orientation. All the data that was used to calculate efficiency was taken from these twelve trials. The average values for the twelve trials is shown below in Table 1.
Table 1: Average Measurements of Each Trial
Data
Data was exported on a per trial basis by the Vernier software to a tab delineated text file. Each trial data set was then imported into an excel spreadsheet for calculations before being imported to a Google spreadsheet for publication. Due to fluctuations (see error section)in the energy received by the wind fans and the energy produced by the generator a per trial average was used. The box fan on Medium setting with turbine blades at a 90 degree angle performed the best at ~.2 % efficiency. The next most efficient trial was with the large floor standing fan and produced a similar efficiency. Data for all of the 12 trials was included in the analysis and is available via this website’s data links section. The graph below shows the trials and efficiencies calculated. The graph show the speed (Medium,MD,or High,HI) , the angle of the turbine blades , trial number , and the calculated efficiencies for the box fan. It also shows the Big Fan values for efficiency at both 30 and 90 degree turbine blade orientation. All the data that was used to calculate efficiency was taken from these twelve trials. The average values for the twelve trials is shown below in Table 1.
Table 1: Average Measurements of Each Trial
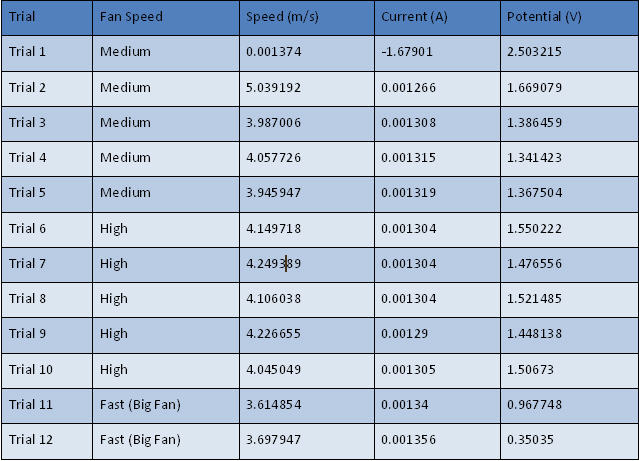
Even though each set of trials were taken using different fan settings, the wind speeds that were measured are very similar. The Big Fan, which was the most powerful, has a wind speed that is considerably lower than that of the Box Fan on the high setting. The Big Fan though had to be moved ~10 away from the apparatus because it would cause the apparatus to tip and fall if it was too close (See pictures #1 and #2). The current produced in all of the trials is the most constant metric, with the outliers coming from earlier trials that took place when kinks in the process were still being worked out. In the same vein, the voltage produced by each trial was relatively constant, although the voltage measured during the trials with the big fan was considerably lower than its counterparts.
Experimental Analysis
Calculations
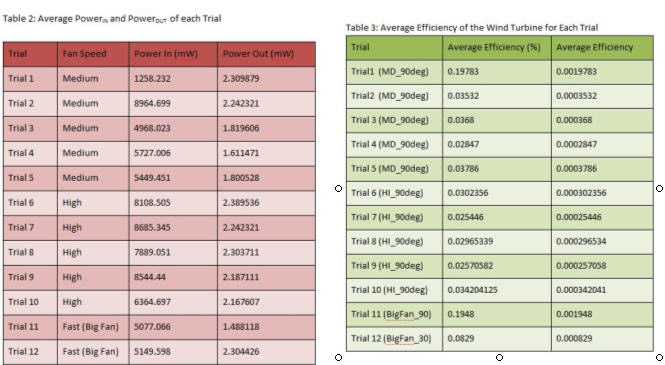
The following equations were used to calculate all needed measurements. Namely, and in order, The first equation is the standard Kinetic Energy (KE) formula. The second equality to KE was used as our Power In formula (equation 2). This gave the linear KE of the wind which the blade changed to rotational Kinetic Energy and then which the generator turned to electricity. Power Out was calculated solely based on our readings from the volt and current meter (V and I respectively). This is a standard Power equation which states power equals voltage multiplied by current (Equation 3). With the Power In (Wind Power) and Power Out (Turbine Generator Electricity) calculated an efficiency can be calculated by division of Power Out by Power (Equation 4). In all cases this number was multiplied by 100 to represent the number as a percent versus a simple ratio. The results of the efficiency calculation were graphed based on trial and presented in Graph 1 below. Furthermoe, Table 2 shows the Average Power In and Power Out on a per trial basis and Table 3 shows the calculated efficiency in table format.
Equation 1: KE = 2 = 2
Equation 2: Powerin = air A3
Equation 3: Powerout = V x I
Equation 4: Efficiency =
Experimental Analysis
Calculations
The following equations were used to calculate all needed measurements. Namely, and in order, The first equation is the standard Kinetic Energy (KE) formula. The second equality to KE was used as our Power In formula (equation 2). This gave the linear KE of the wind which the blade changed to rotational Kinetic Energy and then which the generator turned to electricity. Power Out was calculated solely based on our readings from the volt and current meter (V and I respectively). This is a standard Power equation which states power equals voltage multiplied by current (Equation 3). With the Power In (Wind Power) and Power Out (Turbine Generator Electricity) calculated an efficiency can be calculated by division of Power Out by Power (Equation 4). In all cases this number was multiplied by 100 to represent the number as a percent versus a simple ratio. The results of the efficiency calculation were graphed based on trial and presented in Graph 1 below. Furthermoe, Table 2 shows the Average Power In and Power Out on a per trial basis and Table 3 shows the calculated efficiency in table format.
Equation 1: KE = 2 = 2
Equation 2: Powerin = air A3
Equation 3: Powerout = V x I
Equation 4: Efficiency =
Graphs
Graph 1: Calculated Efficiency by Trial
Graph 1: Calculated Efficiency by Trial
Results
When the blades were positioned at 90 degrees, the wind turbine performed the best efficiency-wise as evidenced by Graph 1 above and Table 2 below. When the blades were turned in any other orientation the efficiency and power produced dropped of significantly. Even though these particular trials saw the highest efficiency of all the trials, no efficiency greater than .2 % was seen. Within these sets of trials, highest efficiency was seen during the trials that used the box fan set at medium speed when the box fan was perpendicular to the fan. This seems counter-intuitive as one would expect that when sets of trials are performed at the same angle and distance, the trials that were privy to the highest wind speeds would produce more energy. This, however, was not observed as the trials that were subjected to the highest wind speeds showed that the wind turbine was often less efficient at higher speeds. In conclusion, no true and sound results should be inferred in any way from this experiment as introduced error certainly had an obvious and noticeably effect on the results and data collected.
Errors
There is no perfect experiment; as it exists in an imperfect world, the experiment will be affected by flaws characteristic of the scientific process. There are three basic types of error that can plague any experiment. There is measurement error, which is sensor-based; process error that is trial-based, and methodology error that is dependent on the analysis carried out on the data. For this lab, there is a focus on the measurement error that results from the tools used during the experiment. Even though the scientist does not manufacture the tool, it is imperative that there is an examination of any sensor used during the experiment beforehand so that one can be aware of the unit error that comes about from simply using the tool. These errors cannot be avoided, but it is important that one uses the tool most appropriate for the job and acknowledges the flaws inherent to any tool in a discussion of the experiment.
Specifically, some errors which may have been introduced will be discussed. We measured angle of wind hitting the sensor and rotor. This angle was measured using a protractor which is imprecise. A error of +/- 2 degrees could have easily been introduced with this measurement method. At 2 different times the force of the wind generated by the big fan knocked the apparatus down within the final 10 seconds of the trial and due to time constraints the data from these experimental runs were used. The wind from the fans were not consistent and fluxed between -.02 m/s to 4.1 m/s. The data on wind speed was averaged for our computations giving the impression of a steady state of wind speed which was not true. Some of the small fan settings were not able to spin the rotors without a slight nudge to start it though it rotated without help after the initial push. Finally, the Vernier device used to measure wind speed was placed to the side of the apparatus and not directly between the apparatus and the fans which may have biased the measurements as the fans produce different wind speeds at different areas of the fan exhaust.
Conclusion
Though the results should not be considered useful to science in any way the exercise itself served as a good foundation for the understanding of wind based kinetic and wind turbine power generator mechanisms and processes. A growing understanding of the physical processes and forces at work were well illustrated and increased the knowledge base of all participating parties.
